MongoDB Collections Overview
Disclaimer
This is an Experimental Dashboard that is not part of the official Percona Monitoring and Management (PMM) deployment and might be updated. We ship this Dashboard to obtain feedback from our users.
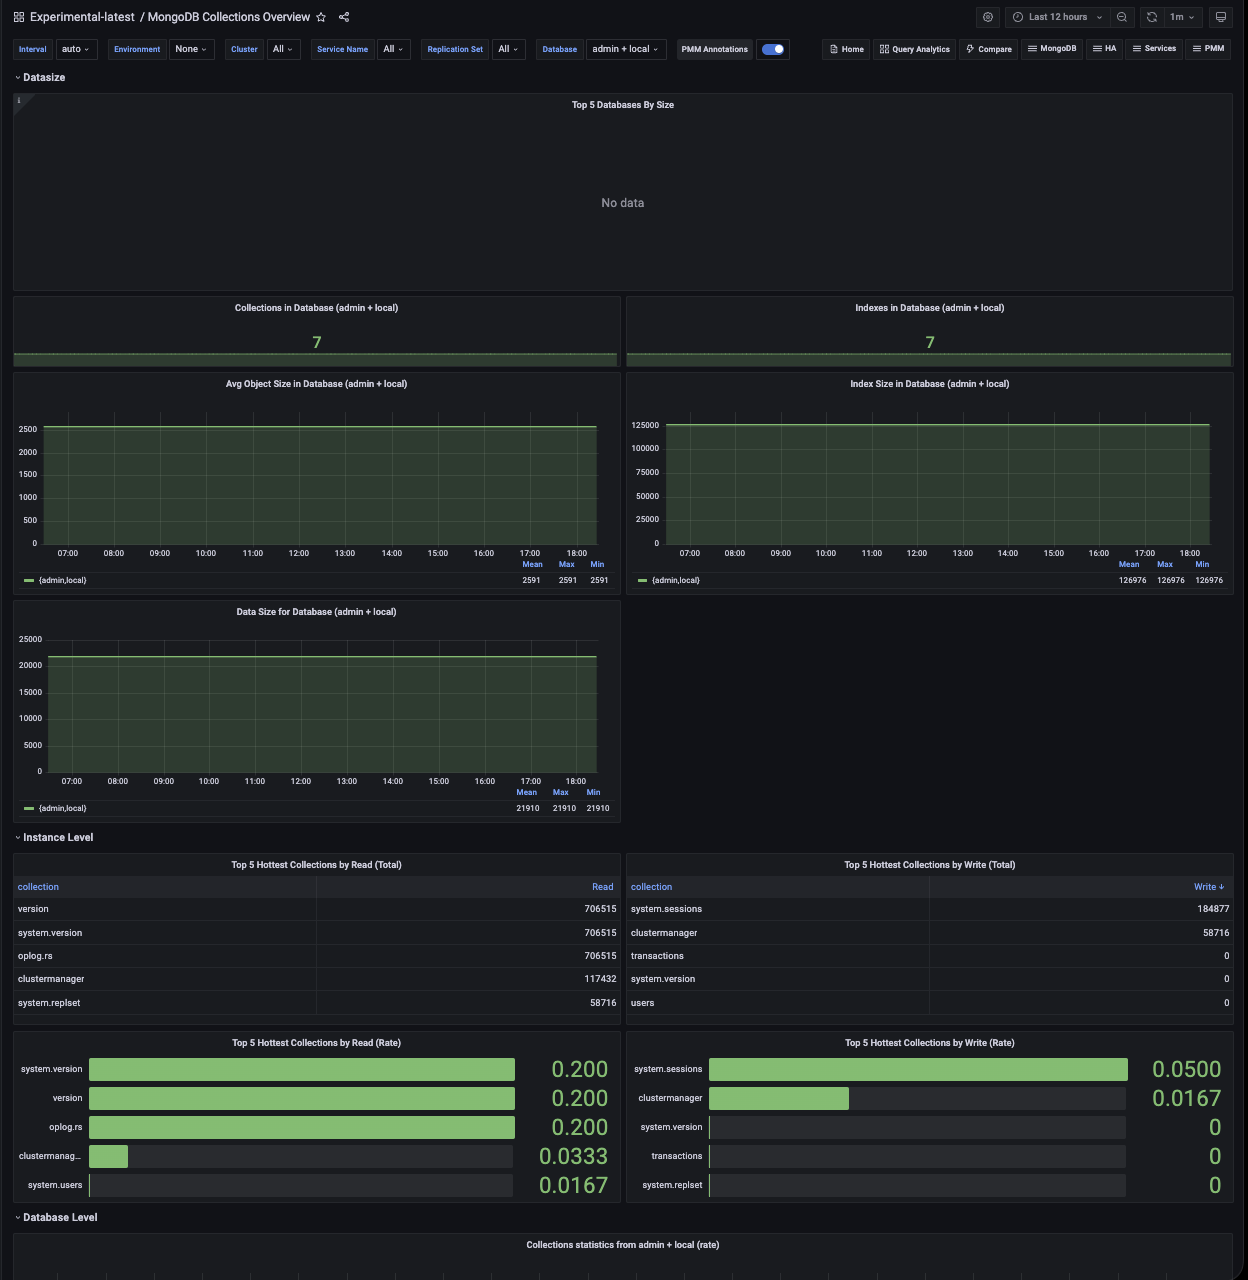
This realtime dashboard contains panels of data about the hottest collections in the MongoDB database.
The Instance level includes two panels, one for Hottest Collections by Read (Total) and one for Hottest Collections by Write (Total).
The dashboard also includes Hottest Collections by Read (Rate) and Hottest Collections by Write (Rate) bar gauges. These panels show operations per second using a stable rate window, and the labels are kept visible for long collection names.
The next panel displays data at the Database Level, where you can view MongoDB metrics such as Commands, Inserts, Updates, Removes, and Getmore.
The last panel shows the number of operations in the chosen database.